What does a software tool for personnel planning need to offer these days? In addition to frequently demanded collaboration functions, workflows and secure authorizations, adequate reporting – usually with deviation charts – should be available as standard. SAP Analytics Cloud (SAC) provides the use of waterfall charts for such scenarios. We have already implemented and successfully tested this technical chart feature in numerous customer projects for results and impact analysis. A decisive advantage: Waterfall charts can be used to display real-time data in SAC planning applications.
Bring your personnel planning up to date in business and technical terms

Defining key figures
The real challenge in creating waterfall charts lies less in the technical configuration of the chart type and more in the creation of so-called “of which” key figures. Their calculation in personnel planning is by no means trivial and must already be taken into account when creating the data model.
For example, it must be possible to separate currency differences from collectively agreed and individual salary adjustments from a price effect. Currency differences are usually calculated as the difference between planned or actual currencies at different planning or comparison dates.
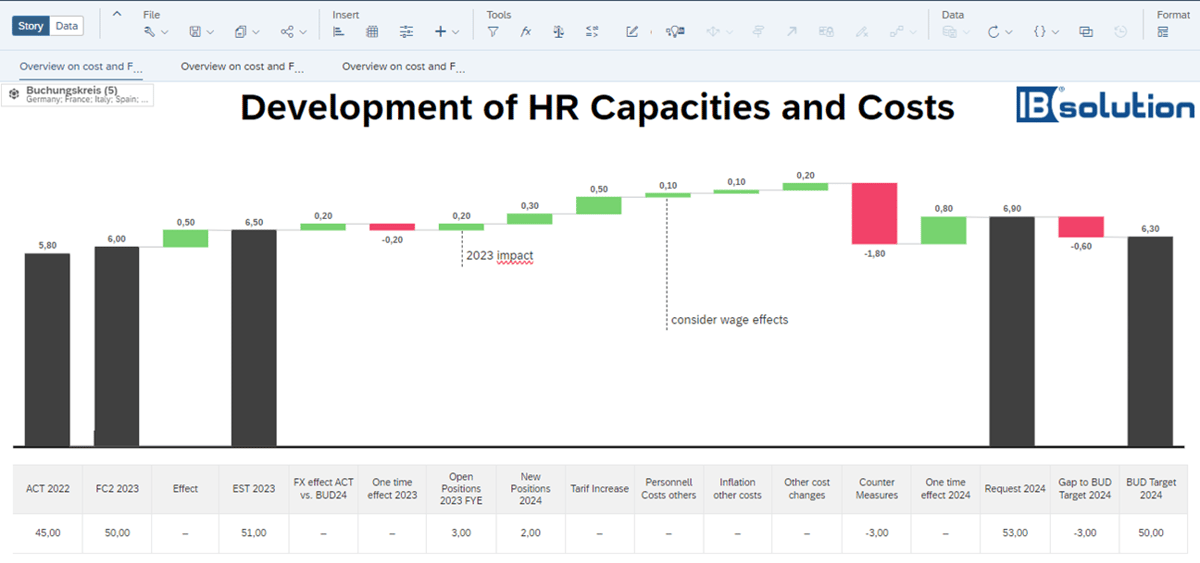
Waterfall charts show how an initial value is influenced by a series of positive or negative intermediate values.
What needs to be considered from a technical perspective
The same applies to the separate accrual and presentation of previous year effects as “of which” figures in a full-year cost comparison. Such accruals and deferrals must also be taken into account during the implementation of the application so that evaluations based on them do not have to be calculated manually in a secondary application.
In addition, new positions should be identified in the planning application in order to be able to display “after-effects” from previous years. Such a derivation is usually carried out using the period reference of the positions from previous periods, which is stored in the transactional upstream systems (SAP HCM, SAP SuccessFactors, SAP H4S4, etc.).
Conclusion: Waterfall charts need the right foundation
If the KPI model has been implemented with foresight from the outset, the creation of automated waterfall charts in SAP Analytics Cloud is ultimately relatively simple. The following applies: Companies should always aim to ensure a maximum degree of process integration and avoid manual corrections and interfaces. In this way, the traceability and integrity of the data can be guaranteed in the best possible way.


