In the era of digitalization, it is not only important to have deep insights about application performance and security but also to know how it is performing in the business context. The effective monitoring and reporting helps organizations to keep the application performance high. The integration and implementation of a monitoring and reporting system can be challenging and expensive. SAP provides out-of-the-box open source software integration as a solution for a better development environment on SAP Cloud Platform.
Application and business data
The SAP Cloud Foundry provides the Elastic Stack (Elasticsearch, Logstash, Kibana = ELK) open source solution to store, analyze, and visualize application log data from cloud foundry applications. The ELK stack delivers meaningful real-time insight from virtually any source of structured and unstructured data. The pre-implemented solution makes searching and analyzing data easy.
Using excellent logging services and the Kibana dashboard developer can implement KPIs and visualization for the business important aspects (e.g. used features, purchases, response times (SLA)). How many users registered between a time period? How many products are sold over a period of time? How many service requests are generated over time? Etc.
Various possibilities for visualization
SAP Cloud Foundry provides logging libraries to emit the application logs while the application is running in Cloud Foundry. These logs are collected by Loggregator and stream the logs to the Logstash. The Logstash cleans and transforms the data using pattern matching, geo-mapping, and dynamic lookup. The cleaned and transformed data is streamed out as JSON data to Elasticsearch database. Afterward, Kibana web interface lets users visualize data in terms of bar chart, pie chart, area graph, heat map etc.
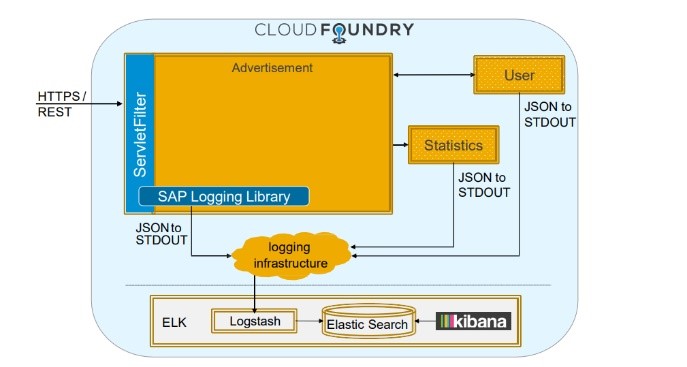
Image 1
SAP Cloud Foundry provides a convenient tool to trace and analyze application logs once the application is deployed with proper logging setup. The logs emitted by the application during execution can be visualized and analyzed through Kibana tool in Discovery submenu as mentioned by number 1 in image 2.
For log analysis, the interval of the available logs can be selected for a time period (date to date, number of days/weeks/months/years). The refresh interval for live analysis can be selected. (marked by number 2 in image 2).
In tabular form
The logs from the application are collected and parsed by Logstash in JSON format and then saved in Elasticsearch database indexes in an unstructured document (fields (keys) and value pair). The user can select the interesting fields to log analysis out of total fields available in an index and analyze the logs in tabular form (marked by numbers 3 and 4 in image 2). Arranging logs in tabular format gives better visibility to search interesting facts about the application.
Kibana Query Language (KQL) helps to search the logs, filter and limit them in an effective way (as shown in number 5 in image 2). KQL can be activated for the index field through options mentioned in the query input box. The Discovery tool in Kibana is a very handy tool to browse the logs as per index fields and query language (KQL), which is impossible using console utility provided by CF (cf log <App Name> --recent). Using Kibana Discovery (image 2) the request logs for „/order“ HTTP endpoint are filtered and queried.
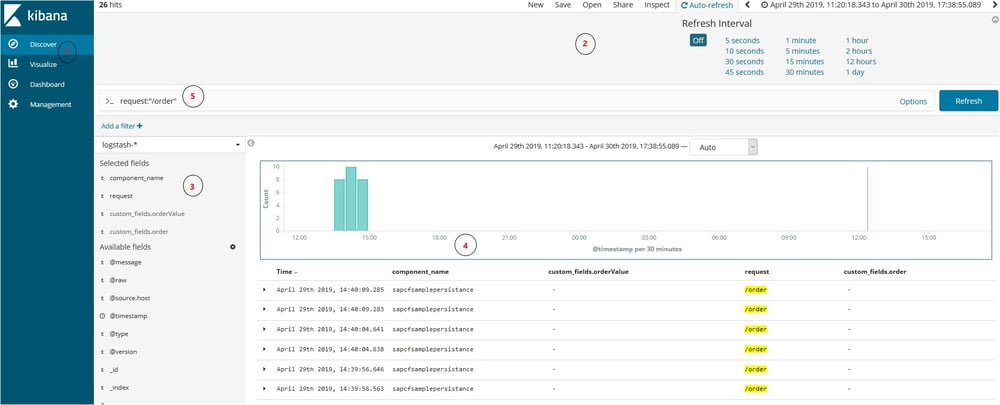
Image 2
Precise overview in the dashboard
Infrastructure and applications are inseparable and influence each other. Ideally, the monitoring tool used shows the performance data in real time in a view. In this way, correlations can be detected quickly and larger failures can be avoided. Kibana dashboard provides a deeper overview of the application at one glance. The information about infrastructure utilization can be monitored and the development team can check time-based user patterns for infrastructure. Based on such information about infrastructure utilization patterns, the development teams and management decide if more resources are required for the application over time. The development team can decide on a microservice horizontal scale-up for highly used services.
In a cloud-based application architecture infrastructure events related to the cloud cannot be left behind. SAP Cloud Foundry Kibana dashboard gives the following important information about the application and infrastructure.
- Uses
- Performance and quality
- Network and load
- Request and logs
- Statics and metric about application and infrastructure
- Errors, exceptions and failures
Image 3 displays an overview of one component of Kibana dashboard provided by SAP Cloud Foundry for application and infrastructure monitoring.
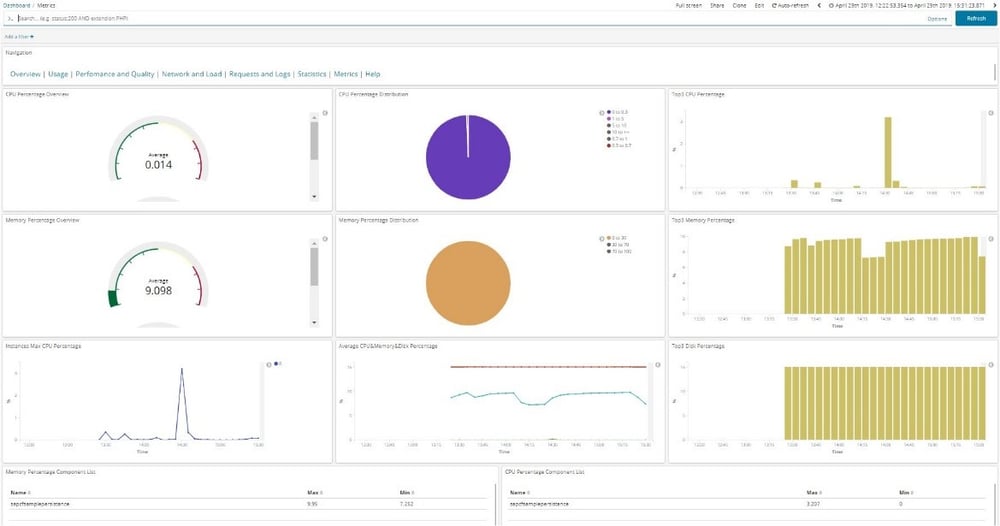
Image 3
Dive into the data
From finance and behavior analytics to usage monitoring and marketing content performance, users get deeper insights into their data with the SAP Cloud Foundry Elastic Stack. The ELK is a scalable cross-platform analytics engine. Kibana provides customized dashboards with gauges, line charts, maps and more to identify high-performing regions, analyze sales funnels and improve website functionality – in real time.
Using the custom logging library logs can be generated that provide business-critical metrics. Such logs can be used effectively to create Business-Centric Custom Dashboards. The Business-Centric Dashboard gives business users an overview of business-critical metrics and insights. Analyze your website traffic and its impact on your business in real time. Build a funnel with web-logs captured by Logstash, analyze your data in Kibana and report to stakeholders in Kibana Dashboard.
Monitoring KPIs
Business Centric Dashboard gives the opportunity to business to set different KPIs for their digital asset and monitor and visualize all the important concern in one view. To maintain digital applications up-to-date and the user-centric business user can use different KPIs, e.g.:
-
Which are the most used features of the application?
-
How many users have registered over time?
-
How many services requests have come over the week?
-
What is parity between user registration and orders?
-
What kind of products users are viewing most?
All such key business information is presented in one dashboard. This information gives deeper insights to take effective decisions improving business.
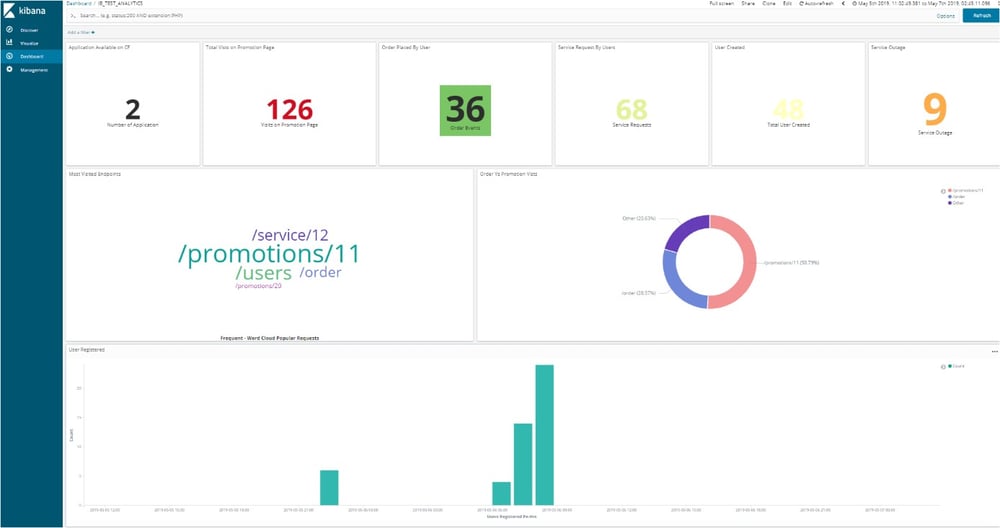
Image 4
Image 4 is an example of a business-centric dashboard that displays the web application’s user analytics KPIs. Business users get the following insights in one look about the real-time performance of their web application (for a specific duration of time):
-
Number of times promotion pages are visited
-
Metrics of total orders placed
-
Total services bought
-
Registered users
-
Application outage instances
-
Word cloud for use case pattern analysis
-
Users registration patterns
These insights regarding web service help the business user for web content management and manage application instances as per load distributions. To take operational and business decisions about digital services offered by organizations, it is important to know how the application is performing in a technical and business sense. The ELK Stack gives greater insight into a different dimension for business and IT users.


