The basic idea behind a microservice architecture is to make the application’s creation and maintenance easier by disassembling it into small, isolated, seamlessly interacting parts. The software functionality is isolated in several independent modules. Each of them is individually responsible for the execution of well-defined tasks.
The modules communicate with each other using different protocols such as synchronous protocols (API, RPC etc.), asynchronous protocols (AMQP, MQTT etc.) and single or multiple receivers based communication protocols. Each microservice can use a different programming language or database so that new technologies can be tried and integrated at any time. In addition, legacy systems can be extended with the code blocks without making any major changes to their code base.
Adaptable to your needs
Companies gain a lot of flexibility through microservices. You can react faster to changes, try new things and save resources. Since the individual components are isolated from each other, each function can be designed in a way that is suitable for the company-specific requirements and capacities.
This makes it possible to scale much more accurately and efficiently. For example, if you want to add new functionality to an application, you do not have to rebuild the entire application. This procedure is not only faster, but it also provides more stability in the application. If a new software component does not work properly or fails, it affects only this single, relatively simple microservice – not the entire complex application.
Ensuring traceability
To resolve the problem of traceability it is important to implement proper logging in the service implementation. If you’re running apps on the application platform Cloud Foundry you still need to take care of troubleshooting and monitoring them. This requires extra planning, configuration, and implementation of the logging.
SAP Cloud Foundry’s Loggregator component captures logs from the various components and applications running on the platform, aggregates these logs, and gives users full access to the data either via CLI or the management console. SAP Cloud Foundry can also be configured to export the log data to an external logging solution, and in this article, we will look into exporting this data into the ELK Stack (Elasticsearch, Logstash, Kibana).
Monitoring of key parameters
SAP Cloud Foundry generates automatic logs related to application deployment, utilization performance, and application router. These logs are used for monitoring application health, infrastructure uses, environment errors and application performance.
While you can rely on the standard logging mechanisms, SAP Cloud Platform also offers dedicated support libraries for Java and Nodejs applications running in the Cloud Foundry environment. Different log levels can be set that help the developer for log analyze. Cloud foundry logging library supports following common logging levels.
-
Error
-
Warn
-
Info
-
Verbose
-
Debug
-
Silly
The libraries serve the following purposes:
- Provide means to emit structured application log messages
-
Instrument parts of your application stack to collect request metrics
Features of Cloud Foundry Logging Library:
-
Network logging (HTTP requests) for Cloud Foundry
-
Custom message logging
-
Logging levels
-
Dynamic logging level threshold (per request)
-
Extendable field configuration
-
Sensitive data reduction
Best practice implementations
Enabling proper logs through code help to investigate and analyze how different services are running in production. The logs give the developer an overview of infrastructure uses, errors, bottlenecks, SLA metrics, and performance, etc. Before the start of implementation, proper logging strategies and planning are required.
Following are the best practices evolved to implement logging in microservices:
-
Correlate requests with a unique ID
-
Include a unique ID in the response
-
Send logs to a centralized location
-
Structure your log data, always add meaningful and useful data
-
Add context to every request
-
Add traces where it matters
Implemented custom logs according to best practices give more clear data to analyze the issue and performance of a service. The Loggregator system of Cloud Foundry is used for streaming the log messages and container metrics. The custom metrics are pushed via the REST API. SAP Cloud Platform uses ELK stack to store, parse, and visualize the application log data coming from Cloud Foundry applications.
The right connection
To enable applications to utilize ELK stack for the log analysis and dashboard services, the development team has to create a service instance of application logging and assign the application to the created instance. This binding enables the Loggregator to collect and stream, the custom logs with default application routing and other service health-related logs to Logstash. After being cleaned and transformed at Logstash, the logs are stored in NoSql database Elasticsearch and save under logstash* index. Using analysis and search capacities of Elasticsearch database the development team can analyze the logs, performance, operation, and action performed on running service in almost real time.
Analyzing and visualizing
Every application deployed in Cloud Foundry generates default logs related to application routing, application health and infrastructure uses. Once the application is bind to application logging service instance this log can be analyzed and visualized in ELK stack.
As discussed in the previous section Cloud Foundry provides various libraries in a different language for logging. The internal logging framework aggregates all the customer log messages and adds the log information to Elasticsearch database field @message or msg as a string. The code generates logs can also found in logstash* index field msg. Below the use of Node.js logging, the framework is shown (similar to the Java-based logging library).
Example: Basic node.js express server with custom log message:
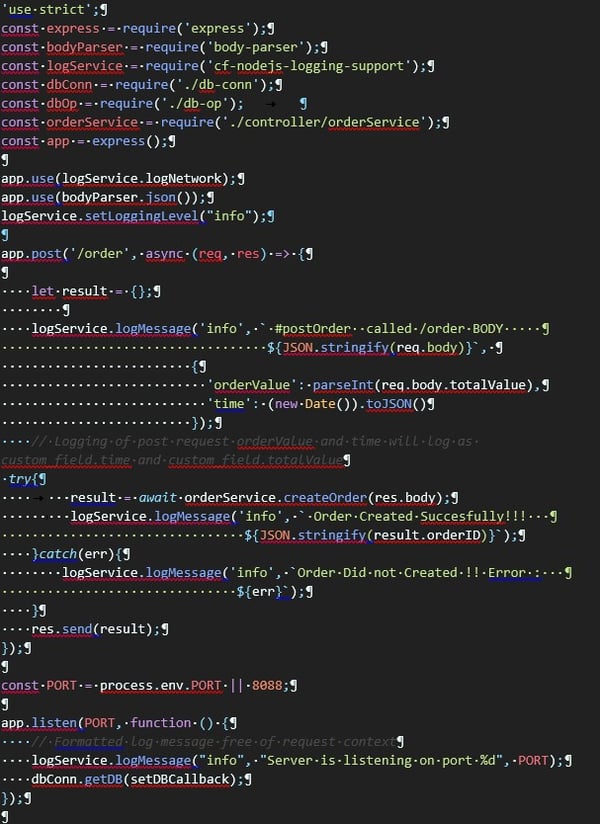
The source code shows how logging framework is used with node.js logging library.
A post request to create order is used as an example. Three logging cases are used:
-
Logging the request with the request body
-
Logging the success or failure of an order creation
-
Logging the information on which server is running
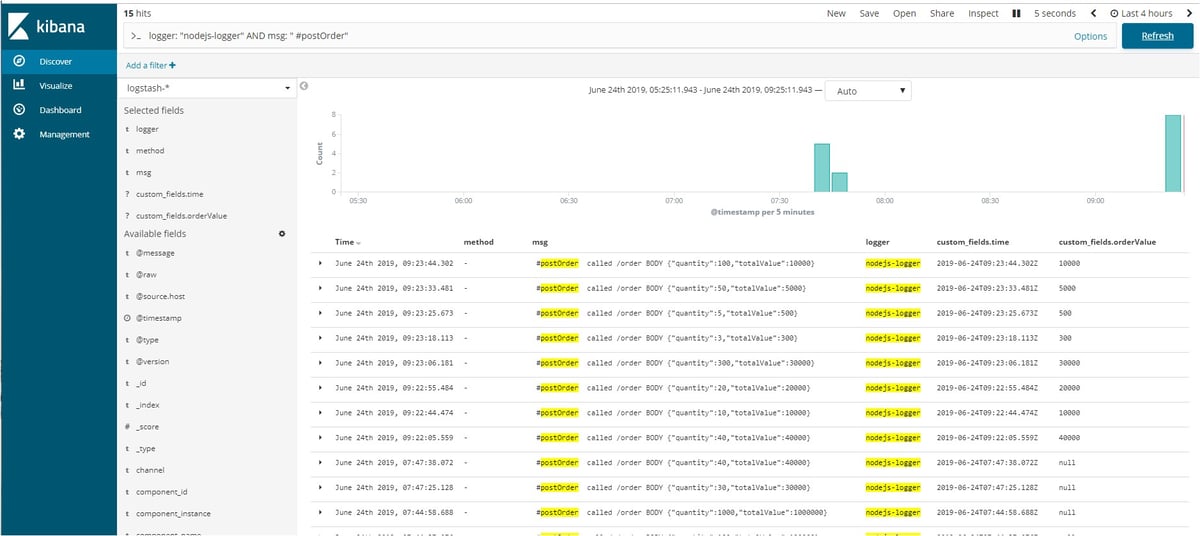
As soon as a client submits an order request to the backend with /order URL and request body, the logging library sends it to Logstash to parse the logs and save it to Elasticsearch database index logstash*. This later can be searched and visualized in Kibana Discovery Tab.
These logs can be analyzed in Kibana UI at Discover tool. In the image below it can be seen that above-emitted logs can be retrieved in logstash* index with msg field.