en

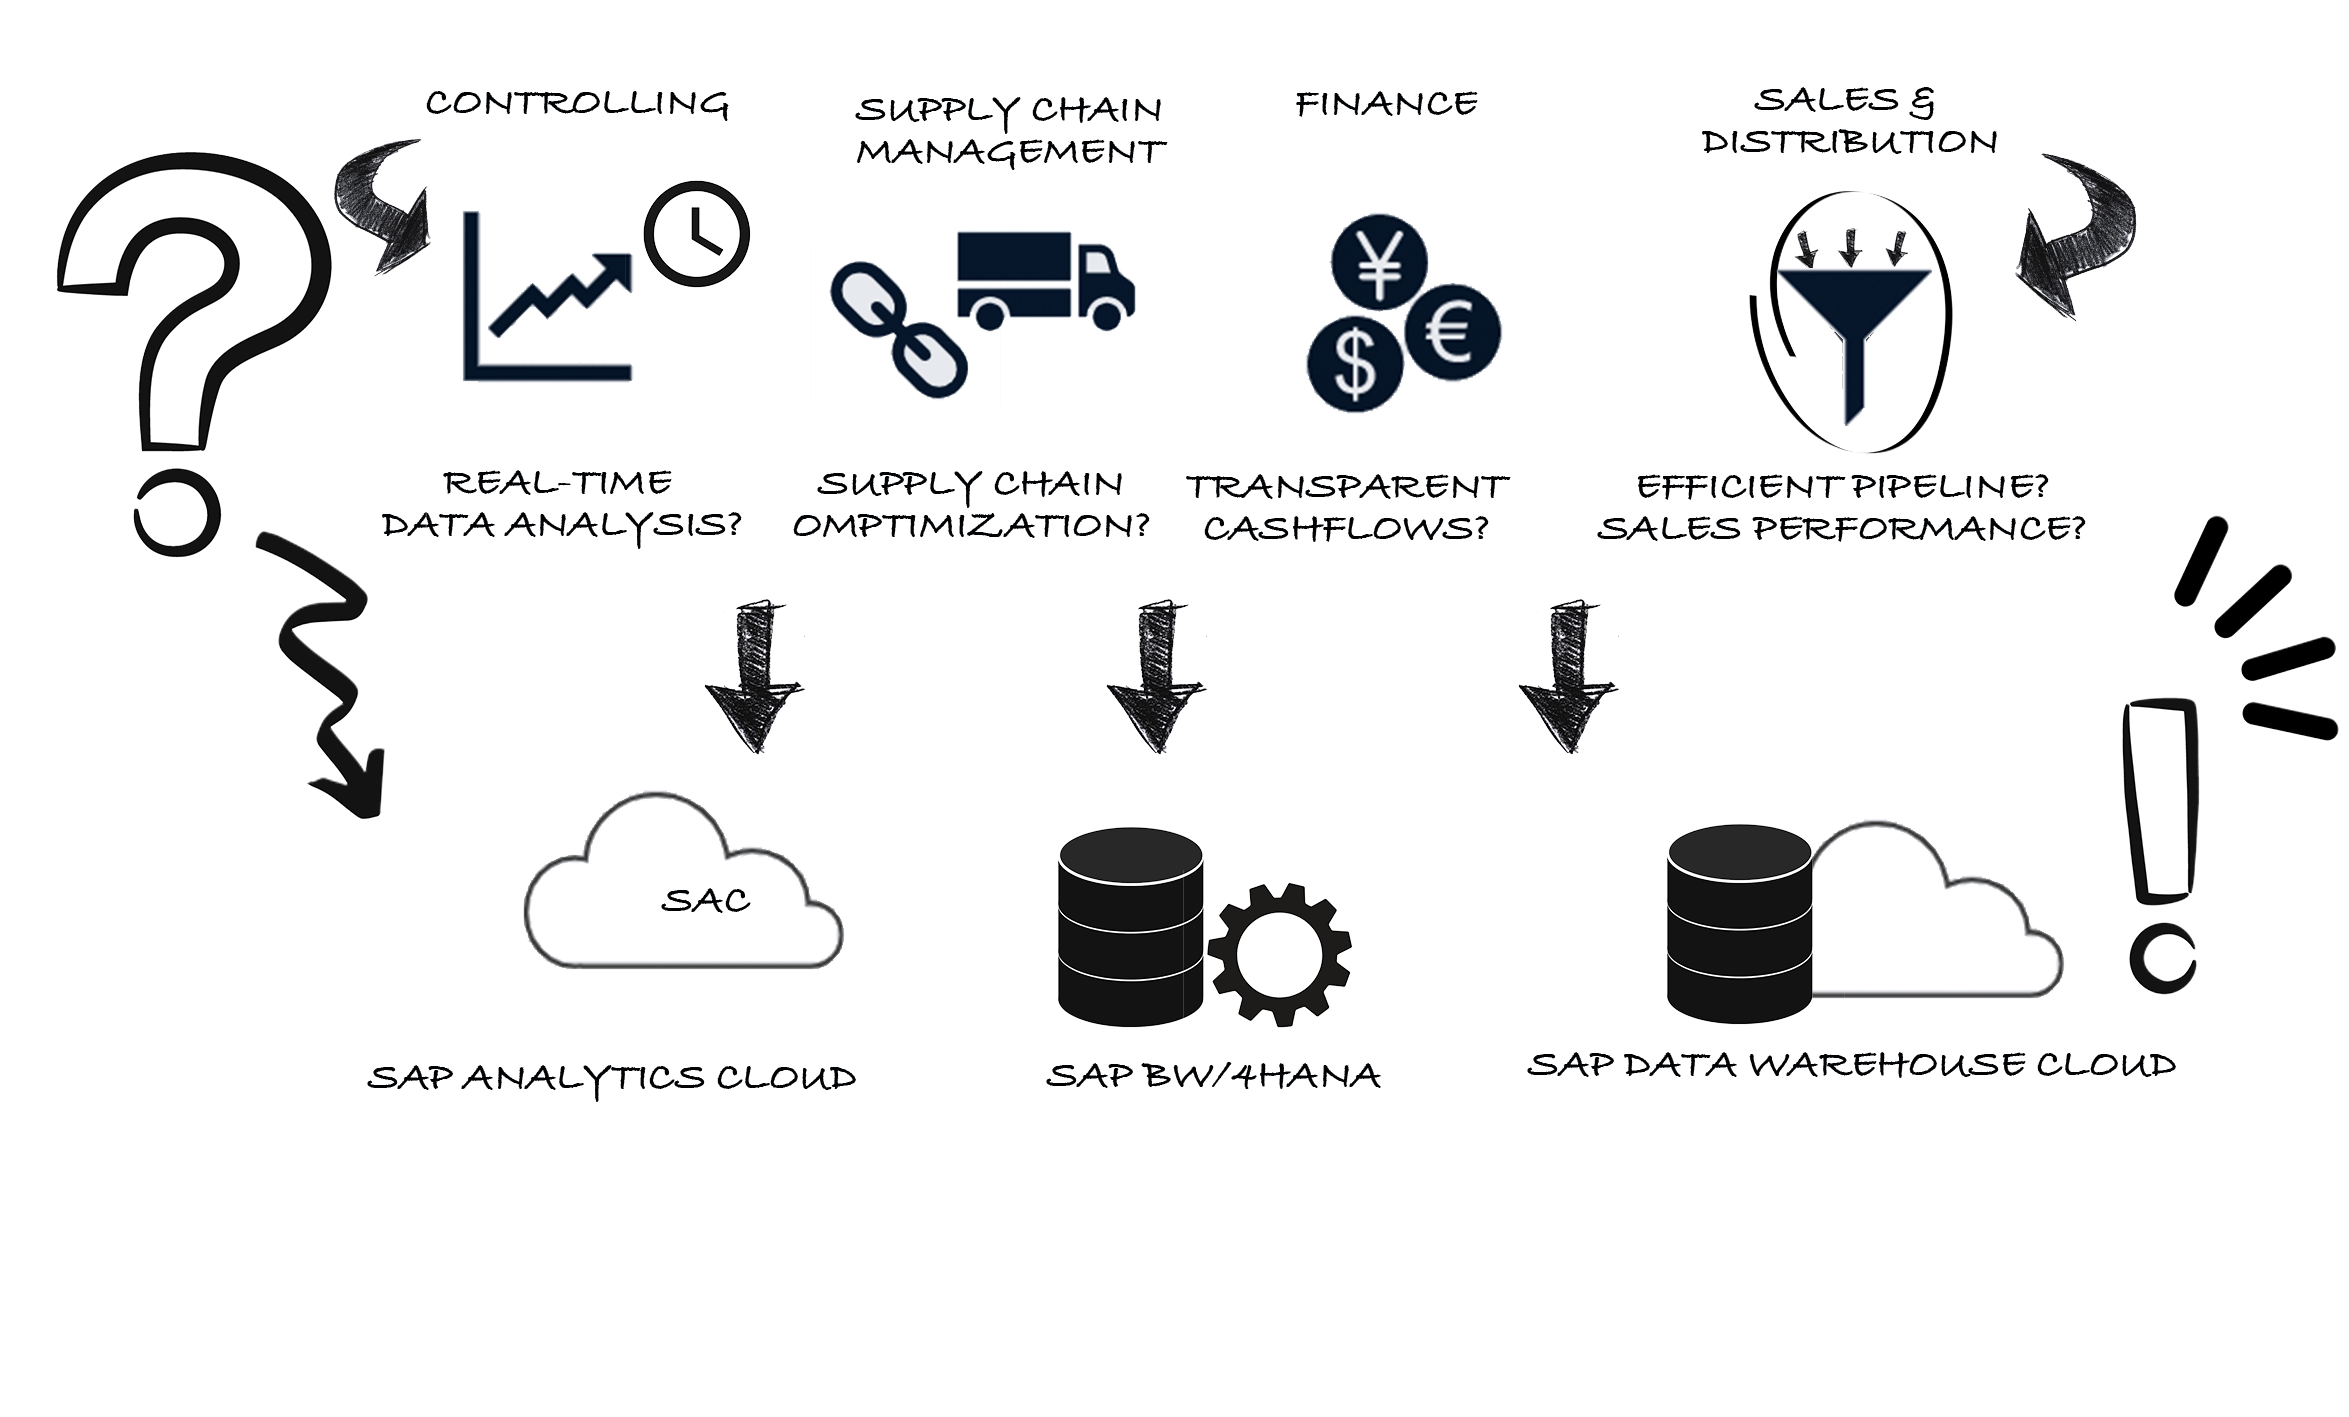
Different departments within a company face different challenges and have specific reporting requirements. We address the most important challenges and show you how you and your department can benefit from customized reports.
How can data be analysed in real time and reported to management?
How can data be prepared faster and more effectively?
How can a reliable data basis be created to make important operational decisions?
How can the achievement of critical objectives of my company be measured?

How can supply chains be optimized?
How can data from different sources be organized to create a uniform data basis?
How can insights be gained in real-time from the collected data?
How can challenges in the logistics landscape be identified and how to deal with them?

How do I create transparency about the cash flows of my company?
How can I efficiently prepare financial forecasts?
How can I accelerate or automate the preparation and transformation of my financial data for reporting?
How can I optimize my data preparation processes?
How do I cleanse financial data so that the data is reliable?
How can I optimally manage my assets?

How can sales performance be monitored and how can deviations be detected at an early stage?
How can the accuracy of forecasts, pipeline efficiency and quota fulfillment be optimized?
How can all sales data from different systems be combined in one platform?

Prepare your data in clear market analyses and reports and present the results to management in attractive dashboards. Access real-time metrics and save time not only in data preparation but also in reporting.

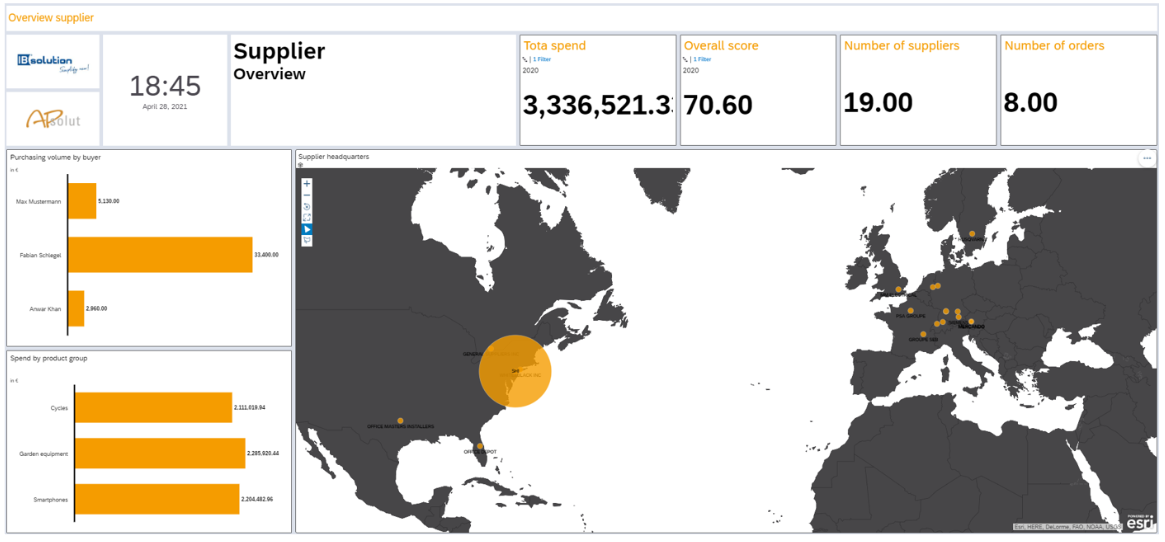
React quickly to changing key figures and always keep an eye on the performance data and risks of your suppliers. Display collected data on a uniform interface and evaluate questions. Intuitive dashboards allow you to quickly identify trends, derive forecasts and develop appropriate recommendations for action.
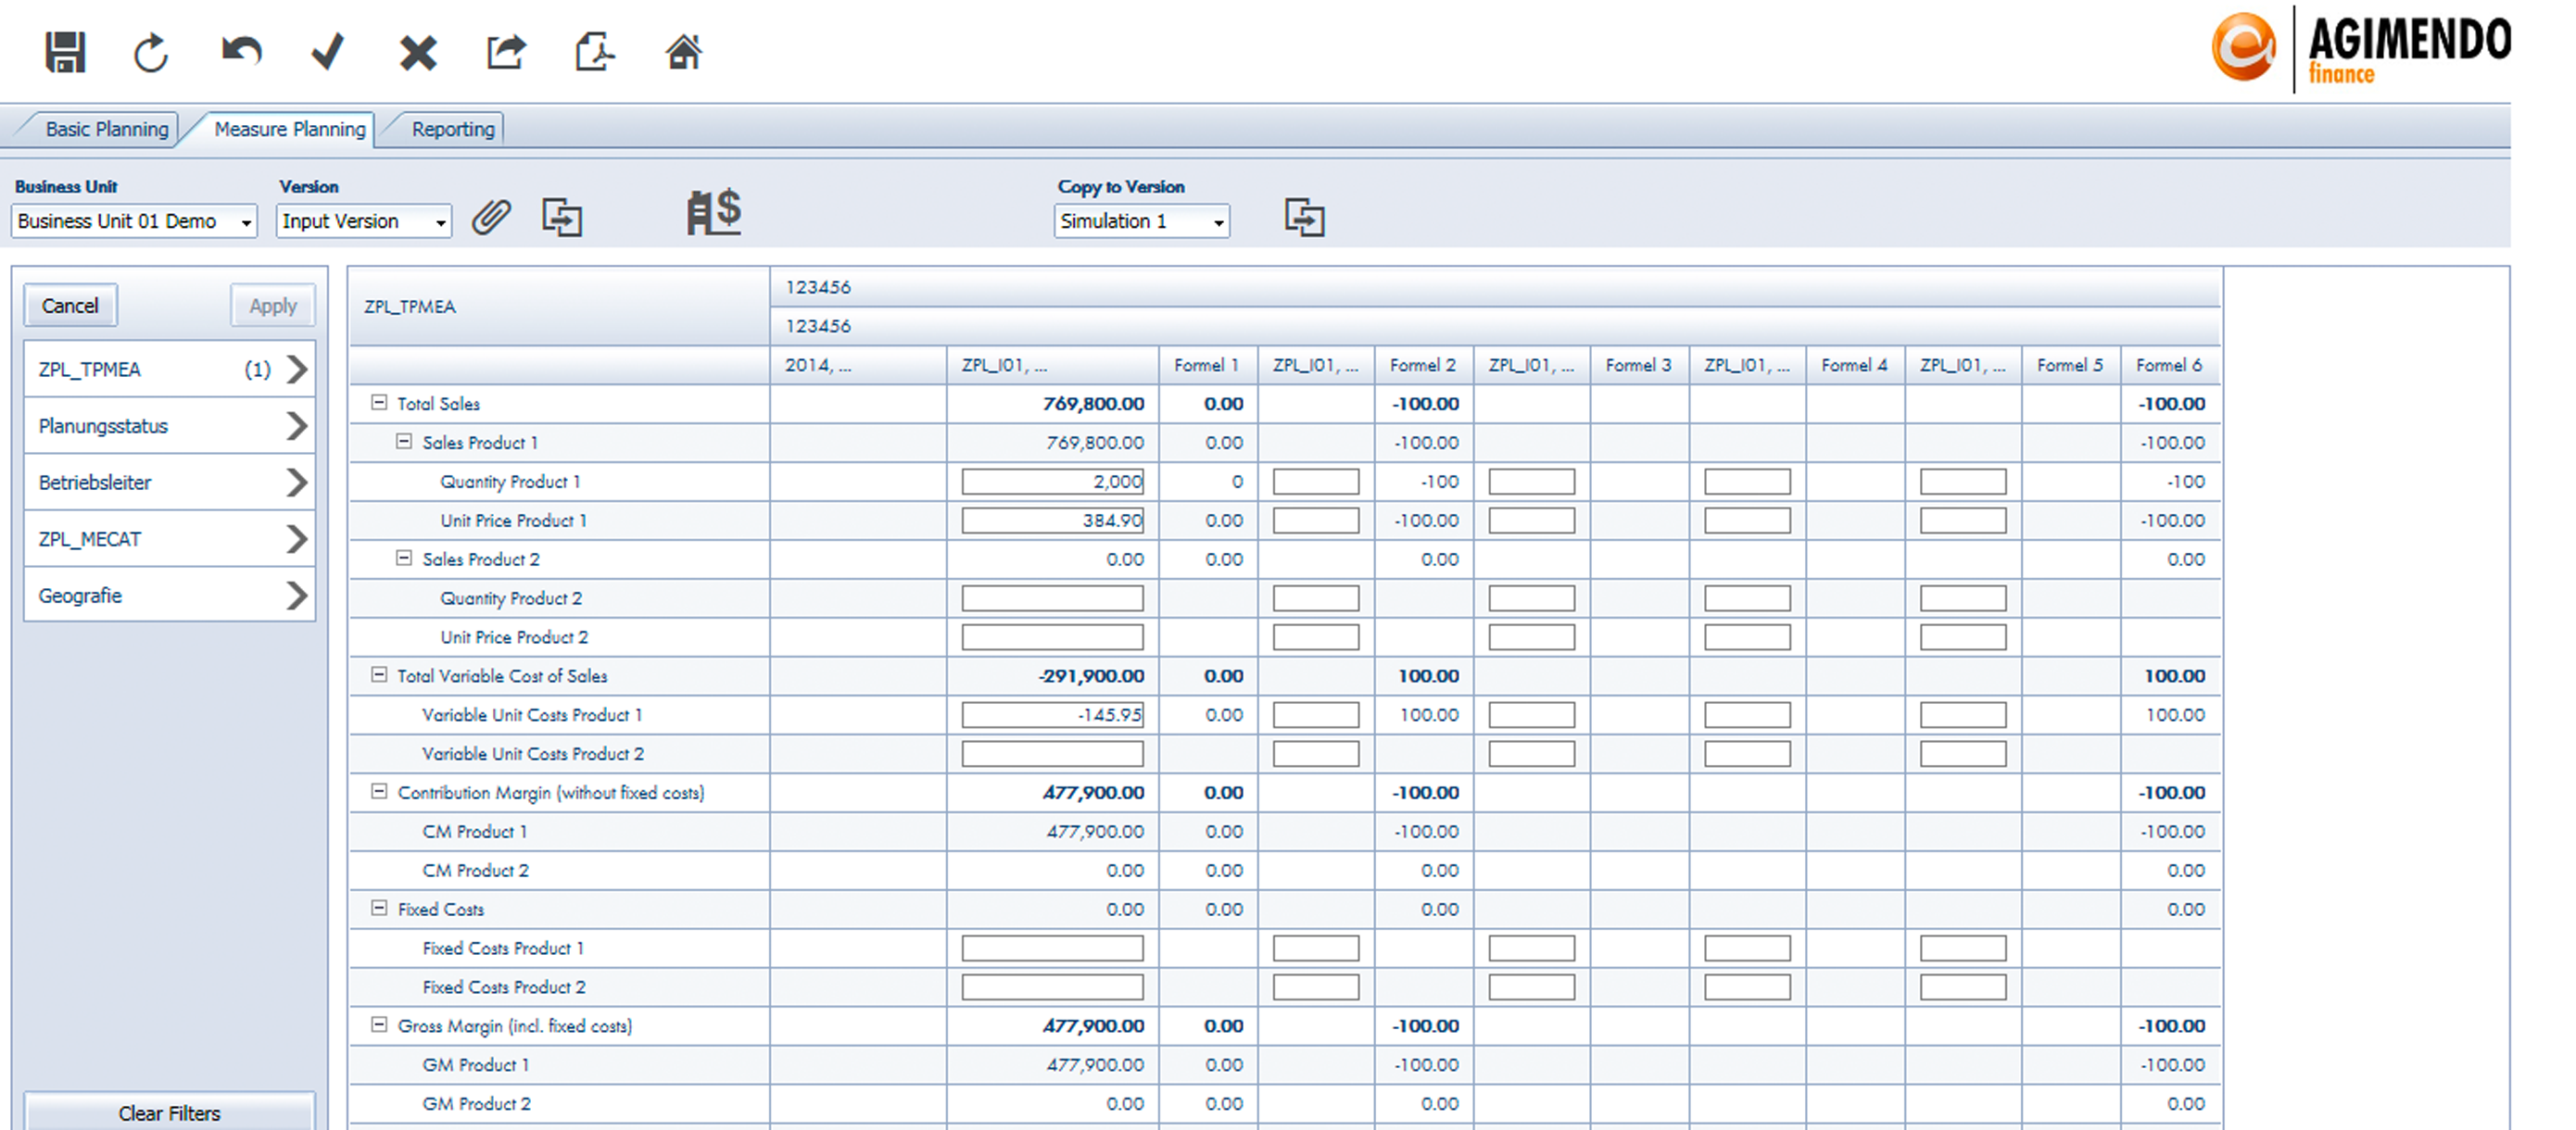
Say goodbye to manual data preparation processes. Consolidate your company data automatically and save resources and time when creating analyses or reports. This way, the specialist department can concentrate on strategic aspects and does not have to deal with the time-consuming consolidation of different Excel sheets or the presentation of different planned measures.
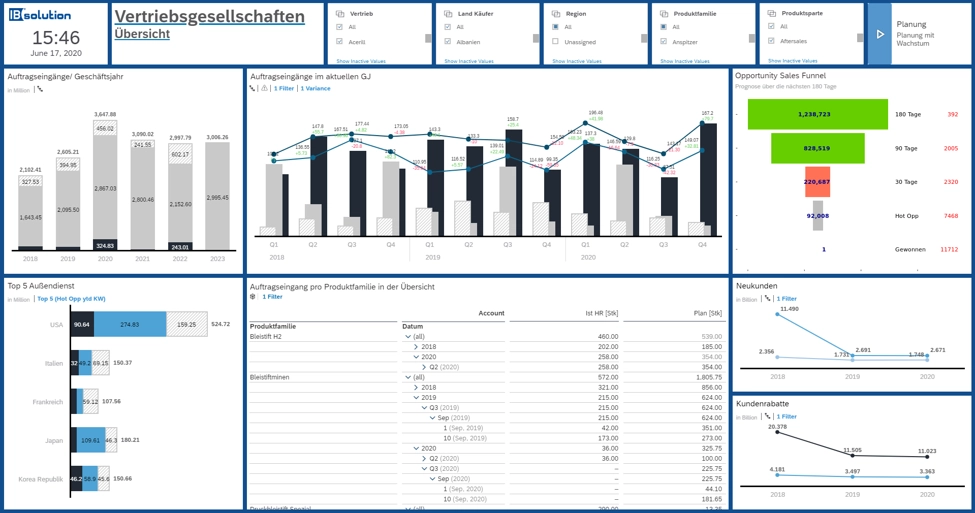
Always keep an eye on your sales figures and create reliable forecasts. Sales staff can access the data they need regardless of their location or device. Individual sales staff can create sales and revenue forecasts themselves and also include prices, conditions and net values. Visualize the results in intuitive dashboards and derive recommendations for action.

Reports are played out in a time-controlled manner
Report content and layout is standardized
Reports are predefined and regularly supplied with current data and distributed
Presentation: Tables and common chart types
Interactive analysis of the data is not included in the process

Live access to information
Always up-to-date data
Applications are used operationally with simultaneous creation of reports
Supervision and control of day-to-day business by managers
Rapid decision making

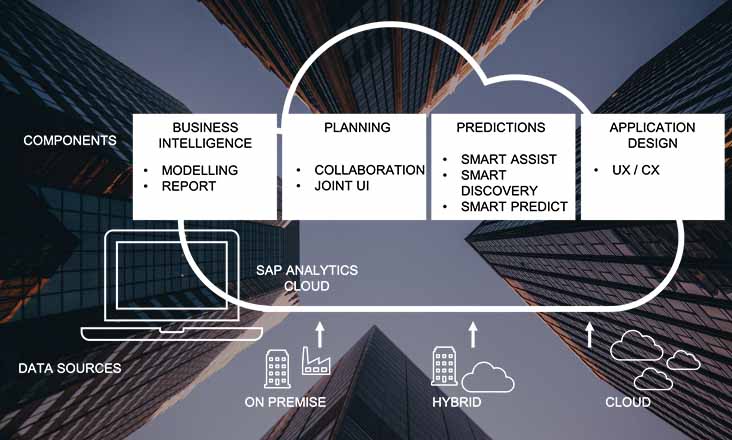
The SAP Analytics Cloud (SAC) offers a central cloud platform as a holistic solution for planning, analysis and reporting. With the help of SAP Analytics Cloud (SAC), data can be modelled intuitively and presented in attractive dashboards. The front-end tool allows decentralised use and ensures a uniform data basis and a sound basis for decision-making throughout the company.

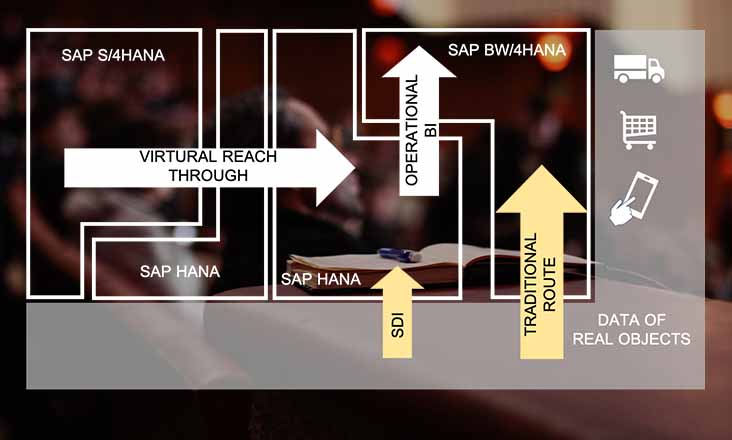
As the basis for comprehensive enterprise data warehousing, as well as a business intelligence and planning environment, the SAP Business Warehouse (SAP BW) enables historical and current data from a wide range of systems to be brought together. In addition, the data can be modelled, consolidated and prepared in order to subsequently make it available to employees for analyses, reports and planning.
The latest generation SAP BW/4HANA even analyses huge amounts of data in real time.

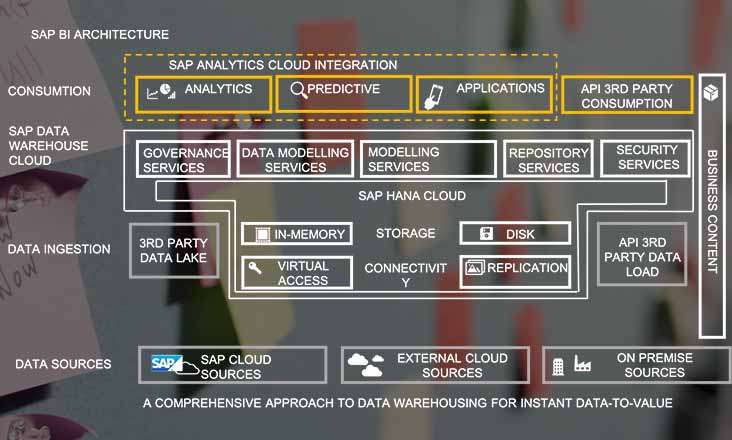
SAP Datasphere is a comprehensive data service in the public cloud and is strongly aimed at business departments – especially those that value the topic of “self-service BI” and want to independently take care of data management in their environment. SAP Datasphere acts as an interface between IT and business. The solution allows the connection of a wide variety of data sources and access to the data in real time. Decision-makers can react quickly to changes thanks to reliable data. In addition, SAP Datasphere has tight integration with SAP Analytics Cloud to cover front-end topics.

Our offerings for your success
Now it's easy to keep an eye on your sales figures and create future forecasts in the SAP Analytics Cloud. With the Starter Package for Sales Planning, this is easy and can be implemented in just 50 days.

Capture supplier performance data and risks at a glance with our Supplier Performance Dashboard and react quickly to deteriorating metrics.

Benefit from the many advantages of the SAP Analytics Cloud in your daily work and, for example, visualise real-time analyses based on data from a wide range of sources. Our experts will provide you with the necessary know-how in a very short time in our Power Workshop for SAP Analytics Cloud.

You have newly implemented SAP Analytics Cloud and need help getting started with SAP's cloud solution?
We are happy to support you and help you with the first steps. Choose your desired topics from various modules.

Get an introduction to the SAP Analytics Cloud (SAC) and learn about the functionalities and possibilities that the SAP Analytics Cloud offers you.


Put your business intelligence and reporting topics in the competent hands of IBsolution. We are not only familiar with the technological, but also with the business aspects of demanding reporting projects.
Together with you, we develop intelligent strategies, define and implement processes, offer downstream support and train your employees. With our ready-made packages, you receive convincing solutions that are ready for use within a very short time.
Take advantage of the expertise and best-practice approaches of our consultants and create a solid basis for your reporting project.
Benefit from our know-how


A selection of our customers